
July 25, 2018
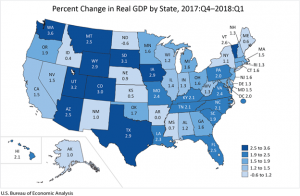
The U.S. Bureau of Economic Analysis indicated that, “Real gross domestic product (GDP) increased in 48 states and the District of Columbia in the first quarter of 2018. Notably, Washington had the fastest growth in the first quarter with a percentage change in real GDP ranging from 3.6 percent to -0.6 percent in North Dakota.”
Nationally as well as in Washington, real estate, rental and leasing along with information services led to the increase in real GDP. While, in North Dakota, mining and construction affected the state’s growth in the first quarter’s real GDP.
The real estate, rental and leasing industry contributed to the growth in 47 states and the District of Columbia as the industry increased by 3.3 percent, nationally.
In addition to Washington, the information services industry contributed significantly to the increase in real GDP in Colorado and the growth in every other state along with the District of Columbia.
Non-durable goods and durable goods manufacturing increased by 3.8 and 3.2 percent, respectively. The non-durable goods increase resulted in growth in 46 states and the District of Columbia. While in the durable goods industry, Great Lakes states of Indiana, Michigan and Wisconsin were the leading contributors to the real GDP increase.
On the other hand, agriculture, forestry, fishing and hunting decreased by 4.6 percent nationally. Given the decrease in the industry, growth was experienced in real GDP in South Dakota and Wyoming, which were among the fastest growing states.
The information contained herein has been obtained from sources believed to be reliable, however its accuracy and completeness cannot be guaranteed. You are hereby notified that any disclosure, copying, distribution or taking any action in reliance on the contents of this information is strictly prohibited and may be unlawful. Mayberry may effect transactions or have positions in securities mentioned herein. In addition, employees of Mayberry may have positions and effect transactions in the securities mentioned herein.


