
October 29, 2020
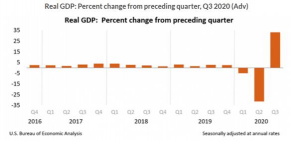
According to the advance estimate released by the Bureau of Economic Analysis, the U.S Real gross domestic product (GDP) increased at an annual rate of 33.1% (7.4% at a quarterly rate) in the third quarter of 2020. This follows a decrease of 31.4% in the second quarter. Real GDP for the third quarter of 2020 is 3.5% below the level of real GDP for the fourth quarter of 2019. The third quarter GDP increase reflected continued efforts to reopen businesses and resume activities that were postponed or restricted due to COVID-19.
The advance was mainly attributed to increases in personal consumption expenditures, private inventory investment, exports, non-residential fixed investment, and residential fixed investment and state and local government spending.
The increase in personal consumption expenditures reflected increases in services led by health care as well as food services and accommodations, which increased by 18.91% and 34.27% respectively. The increase in goods was led by domestic new motor vehicles and the unit sale of parts 40.71% and 35.40% each.
The increase in private inventory investment primarily reflected an increase in retail trade led by motor vehicle dealers which increased to US $55.1million (Quarter 2: US $-270.9 million). The increase in exports primarily reflected an increase in goods led by automotive vehicles, engines, and parts which grew by 138.06% as well as capital goods which went up by 12.71%. The increase in non-residential fixed investment primarily reflected an increase in equipment led by transportation equipment which advanced by 14.05%. The increase in residential fixed investment primarily reflected an 48.32% increase in brokers’ commissions and other ownership transfer costs.
The price index for gross domestic purchases increased by 3.4% in the third quarter, in contrast to a decrease of 1.4% in the second quarter. The PCE price index increased 3.7%, in contrast to a decrease of 1.6%. Excluding food and energy prices, the PCE price index increased 3.5%, relative to a decrease of 0.8%.
Current-dollar personal income decreased $540.6 billion in the third quarter, in contrast to an increase of $1.45 trillion in the second quarter. The decrease in personal income was more than accounted for by a decrease in personal current transfer receipts (notably, government social benefits related to pandemic relief programs) that was partly offset by increases in compensation and proprietors’ income.
Real disposable personal income (DPI) decreased 16.3% in the third quarter, following a 46.6% increase in the second. The decrease in current-dollar DPI was more than accounted for by a decrease in personal current transfer receipts (notably, government social benefits) that was partly offset by increases in compensation and proprietors’ income.
Personal saving was $2.78 trillion in the third quarter, compared with $4.71 trillion in the second quarter. The personal saving rate was 15.8% in the third quarter, compared with 25.7% in the second.
Disclaimer:
Analyst Certification –The views expressed in this research report accurately reflect the personal views of Mayberry Investments Limited Research Department about those issuer (s) or securities as at the date of this report. Each research analyst (s) also certify that no part of their compensation was, is, or will be, directly or indirectly, related to the specific recommendation (s) or view (s) expressed by that research analyst in this research report.
Company Disclosure –The information contained herein has been obtained from sources believed to be reliable, however its accuracy and completeness cannot be guaranteed. You are hereby notified that any disclosure, copying, distribution or taking any action in reliance on the contents of this information is strictly prohibited and may be unlawful. Mayberry may effect transactions or have positions in securities mentioned herein. In addition, employees of Mayberry may have positions and effect transactions in the securities mentioned herein.


