
April 5, 2018
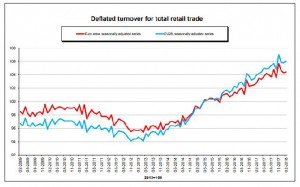
According to a recent release by Eurostat, the statistical office of the European Union, the volume of retail trade increased by 0.1% in the euro area (EA19) and by 0.2% in the EU28 for the month of February 2018, after falling by 0.3% in the euro area (EA19) for the previous month. Retail volumes were flat for EU28 in January 2018. Year over year, the retail sales index increased by 1.8% in the euro area and by 2.0% in the EU28.
The February increase in retail trade volume was due to rises of 0.9% for automotive fuel and of 0.8% for “Food, drinks and tobacco”, while non-food products fell by 0.5%. In the EU28, the 0.2% increase in the volume of retail trade was due to rises of 1.0% for automotive fuel and of 0.8% for “Food, drinks and tobacco”, while non-food products fell by 0.5%. As stated by Eurostat, “among Member States for which data are available, the highest increases in the total retail trade volume were registered in Estonia (+2.0%), Belgium (+1.6%), Malta and Poland (both +1.5%), while the largest decreases were observed in Latvia and Romania (both -2.3%) and Austria (-1.5%).”
What caused the annual rise in retail volumes differ from the cause of the uptick in the monthly report. The 1.8% increase in the volume of retail trade in the euro area in February 2018, compared with February 2017, was due to rises of 2.3% for non-food products, 1.2% for “Food, drinks and tobacco”, while automotive fuel fell by 0.1%. On the other hand, the annual 2.0% increase in retail trade volume within the EU28 was attributed to the following increases of 2.4% for non-food products, 1.4% for automotive fuel and 1.2% for “Food, drinks and tobacco”.
The highest increases in the total retail trade volume were registered in Malta (+11.7%), Poland (+7.9%) and Ireland (+7.1%), while decreases were observed in Slovenia (-1.6%) and Austria (-1.2%).
Company Disclosure -The information contained herein has been obtained from sources believed to be reliable, however its accuracy and completeness cannot be guaranteed. You are hereby notified that any disclosure, copying, distribution or taking any action in reliance on the contents of this information is strictly prohibited and may be unlawful. Mayberry may effect transactions or have positions in securities mentioned herein. In addition, employees of Mayberry may have positions and effect transactions in the securities mentioned herein.


